Truck sales raise a red flag
– authored by New Deal democrat
Two decades back, Professor Edward Leamer garnered significant attention with a presentation to the Federal Reserve, declaring that “Housing IS the Business Cycle.” He emphasized the correlation between declines in the housing market and the onset of recessions, typically occurring about seven quarters later. However, for the current discussion, I would like to zero in on his conclusion that following a downturn in housing, the subsequent sector to experience a decline was business spending on durable goods.
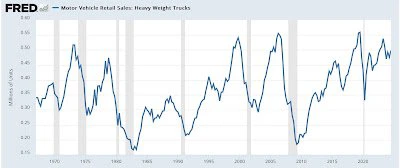
A reliable indicator of business investment in durable goods historically has been the acquisition of heavy-duty trucks. Although sales figures for cars and light trucks can fluctuate significantly, heavy-duty truck sales have consistently shown a tendency to decline by -10% or more ahead of economic downturns, with the only exception being in 1970 (as illustrated in the quarterly averages in the graph below):
View pictures in App save up to 80% data.
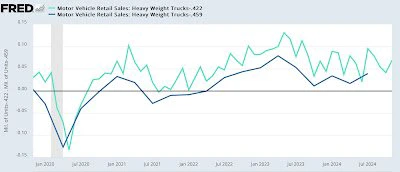
This naturally leads me to discuss the most recent data. It seems that FRED delays updating their graph for a few weeks after the BEA releases the information. To give you the latest figures, in December, the seasonally adjusted sales of heavy trucks stood at 0.422 million annualized (represented by the light blue line in the graph below). For the fourth quarter, the average sales were 0.459 million (depicted in dark blue). As illustrated in the graph below, which normalizes both figures to zero, these numbers represent the lowest sales figures seen in the past two and a half years.
View pictures in App save up to 80% data.
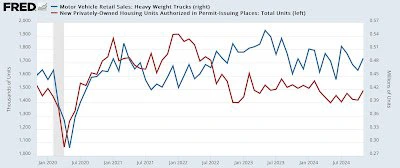
Now, let's incorporate Prof. Leamer's framework into our analysis. Below, I present the complete timeline of housing permits (depicted in red on the left scale) compared to heavy-duty truck sales (illustrated in blue on the right scale):

View pictures in App save up to 80% data.
Aside from the pandemic and the "double dip" recession caused by the Federal Reserve in 1981, housing permits have consistently declined prior to economic downturns and have also reached their highest points before a significant drop in heavy truck sales. While the time lag can vary considerably, the average duration is roughly six months.
Let's take a closer look at the same graph, focusing on the past five years:
View pictures in App save up to 80% data.
Housing permits reached their highest point at the start of 2022, while heavy truck sales followed suit in early 2023. Since the beginning of 2024, permits have seen a slight decline. Although I'm hesitant to base conclusions on a single month’s data, the three-month average indicates that heavy truck sales might be experiencing a similar trend at this time.
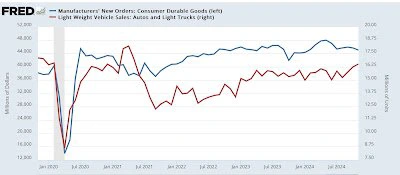
According to Leamer’s theory, the subsequent domino to topple would be the orders for consumer durable goods. The graph below indicates that the overall figure for these orders seems to have reached its peak in the spring of 2024; however, purchases of cars and SUVs have persisted in their upward trend (notably, December, which is not depicted here, actually surpassed November with an annualized figure of 17.1 million):
View pictures in App save up to 80% data.
It is crucial to emphasize that recessions are more concerned with the *trend* of data, such as sales figures, rather than their *absolute level.* Historically, both housing and truck sales have shown a downward trajectory in the initial phases of recessions. In 2024, housing permits remained fairly consistent. Similarly, it is possible that with just a month or two of data, heavy truck sales may have also found a steady state at a reduced level.
The decline in heavy truck sales could be a concerning indicator, which makes it even more important to monitor all aspects of goods-producing employment when the employment report for December is released on Friday. If this downturn has affected jobs in the goods sector, the likelihood of a recession occurring in 2025 has certainly increased.